

Casoli Dam: reading the ground beneath a dam, without drilling
By Tigo Sanchez, CMO · with Chewe Chilufya, Co-CEO and Technical Director · GGM.EARTH
A dam holds back a lake. What holds back the dam? Before a seismic verification, the first thing an engineer needs is a measured picture of the ground the structure stands on. We took one from the surface, with two independent methods, along eight lines.
Why survey the ground under a dam?
Short answer. Because a seismic verification needs to know what the dam rests on, and a dam cannot be filled with boreholes to find out. Geophysics reads the ground from the surface, along lines, without breaking it.
We surveyed Casoli Dam, in the province of Chieti, Abruzzo, as part of the specialist investigations for its seismic verification; the technical report is dated June 2022. The work described here comes from our archive. It is a description of the ground, not an assessment of the dam: the verification belongs to the engineers who run it.
What did we measure?
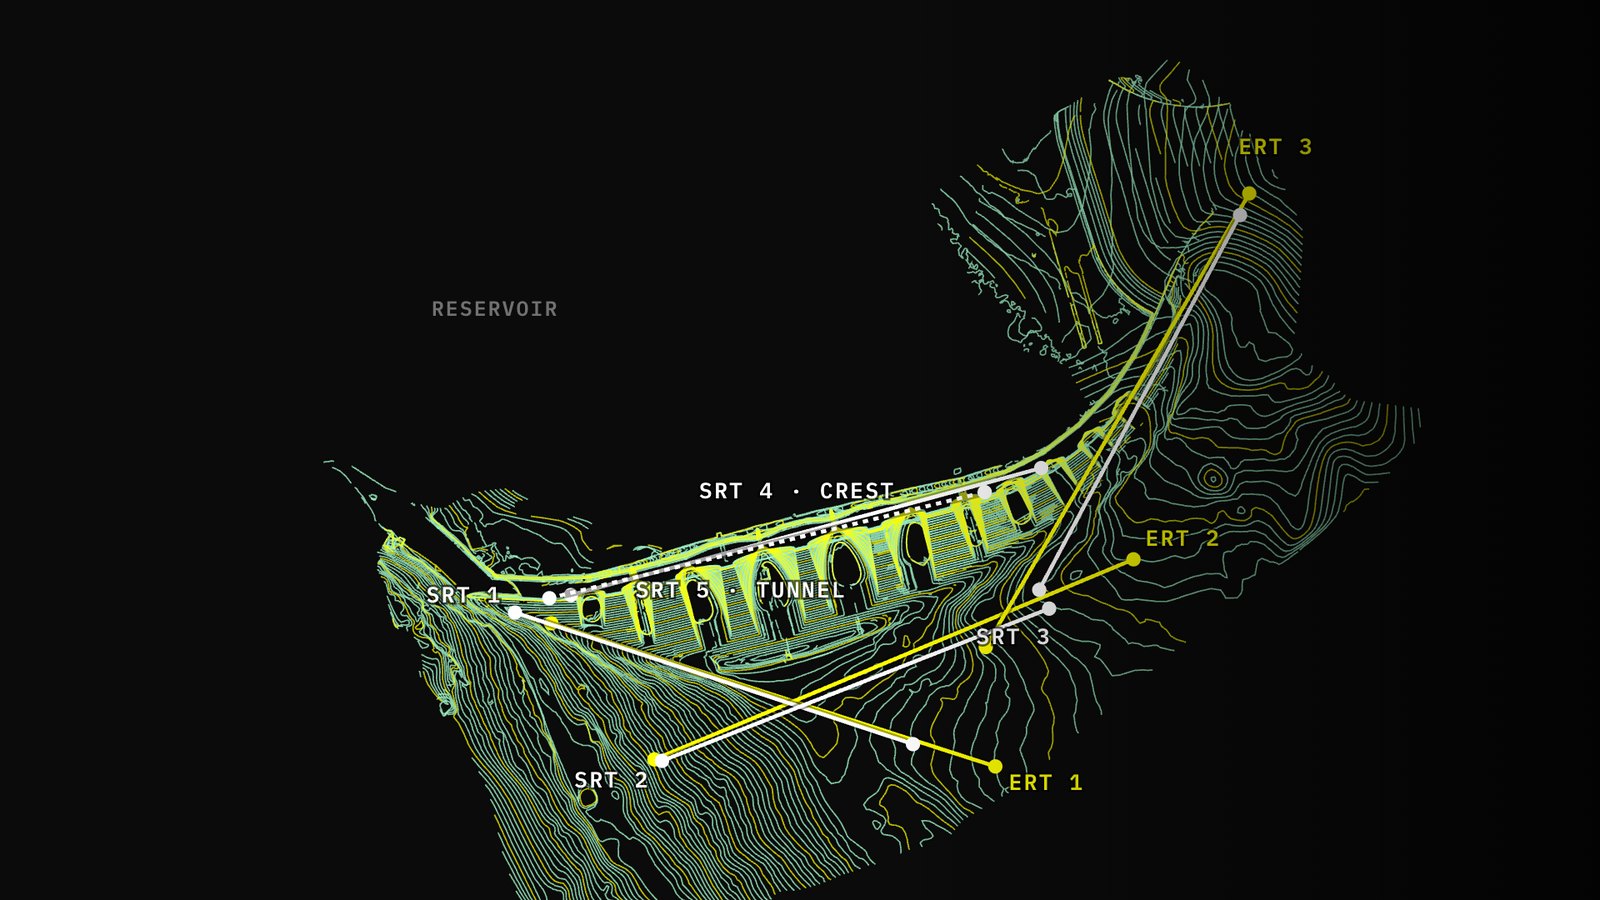
Short answer. Three electrical resistivity lines and five seismic refraction lines. Four of the seismic lines ran on the surface, on the slopes and along the crest of the dam, and one ran inside the tunnel that crosses it. Every sensor was positioned with GNSS RTK.
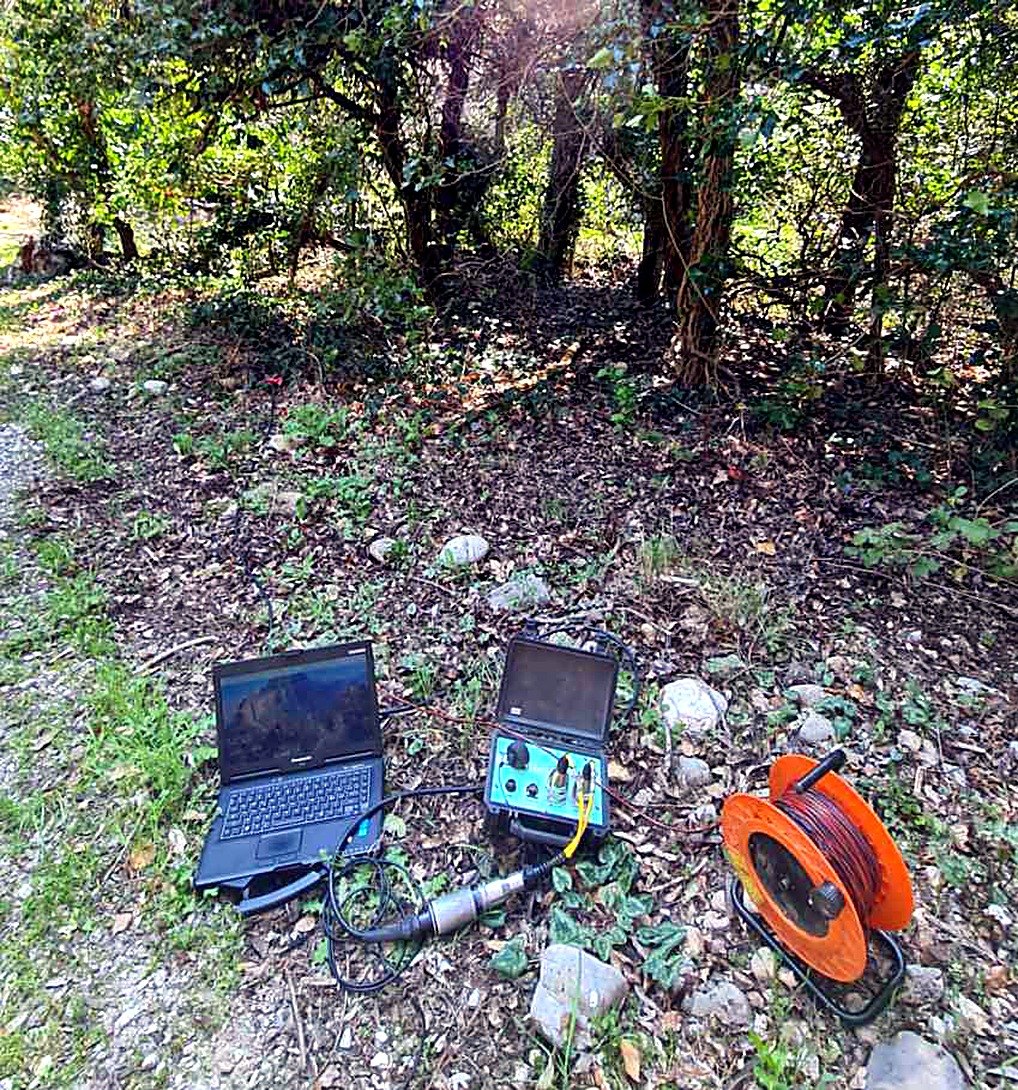
Each electrical line used 48 stainless steel electrodes spaced 3 metres apart, for 141 metres of length and a depth of investigation of 45 to 50 metres. The array was dipole–dipole, with 1,318 four-electrode measurements per line.
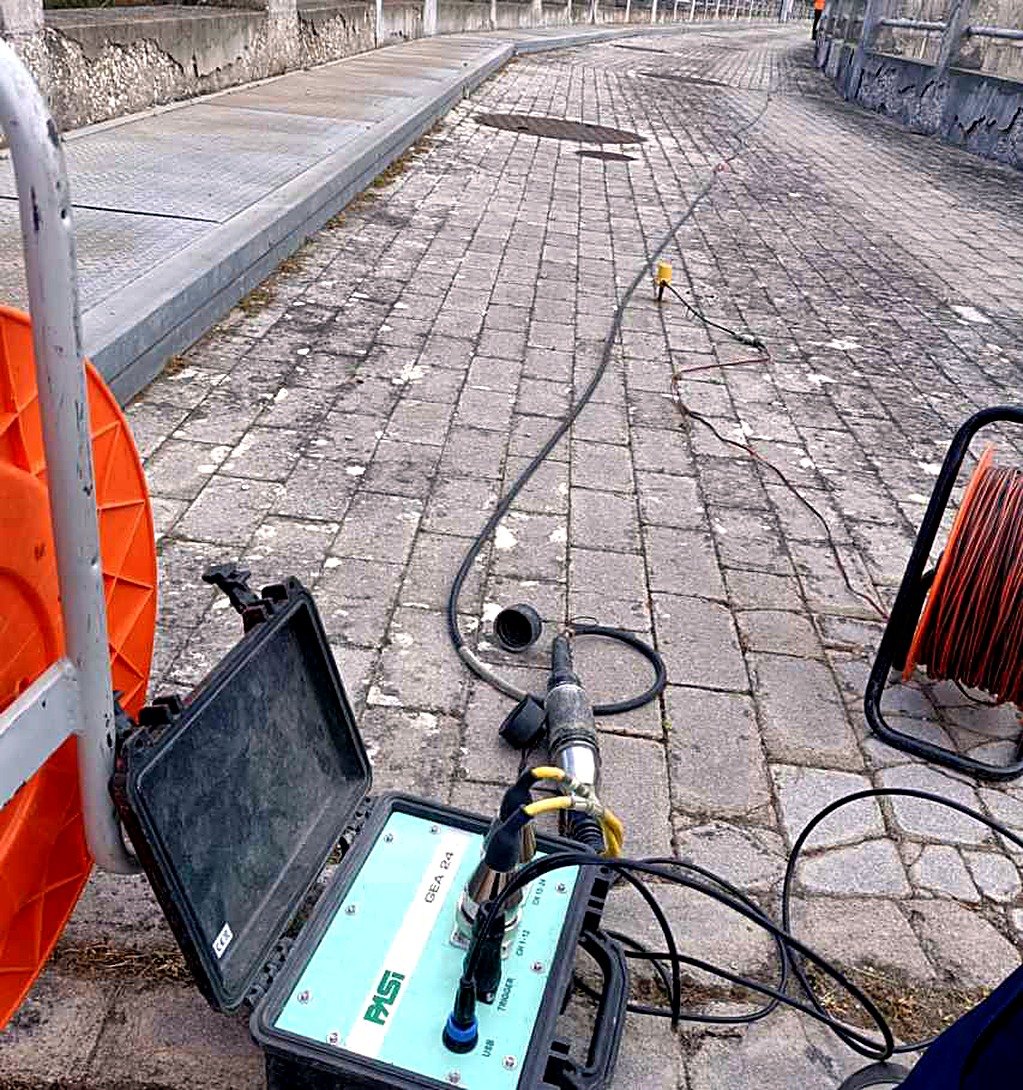
Each seismic line used 24 geophones 5 metres apart, over 115 metres, with nine shot points per line. The energy came from a 10 kg sledgehammer striking a steel plate placed on the ground, summed over several blows to lift the signal above the noise. The crest line and the tunnel line were recorded twice, in compression (P) and in shear (S) waves.
How does electrical resistivity see the ground?
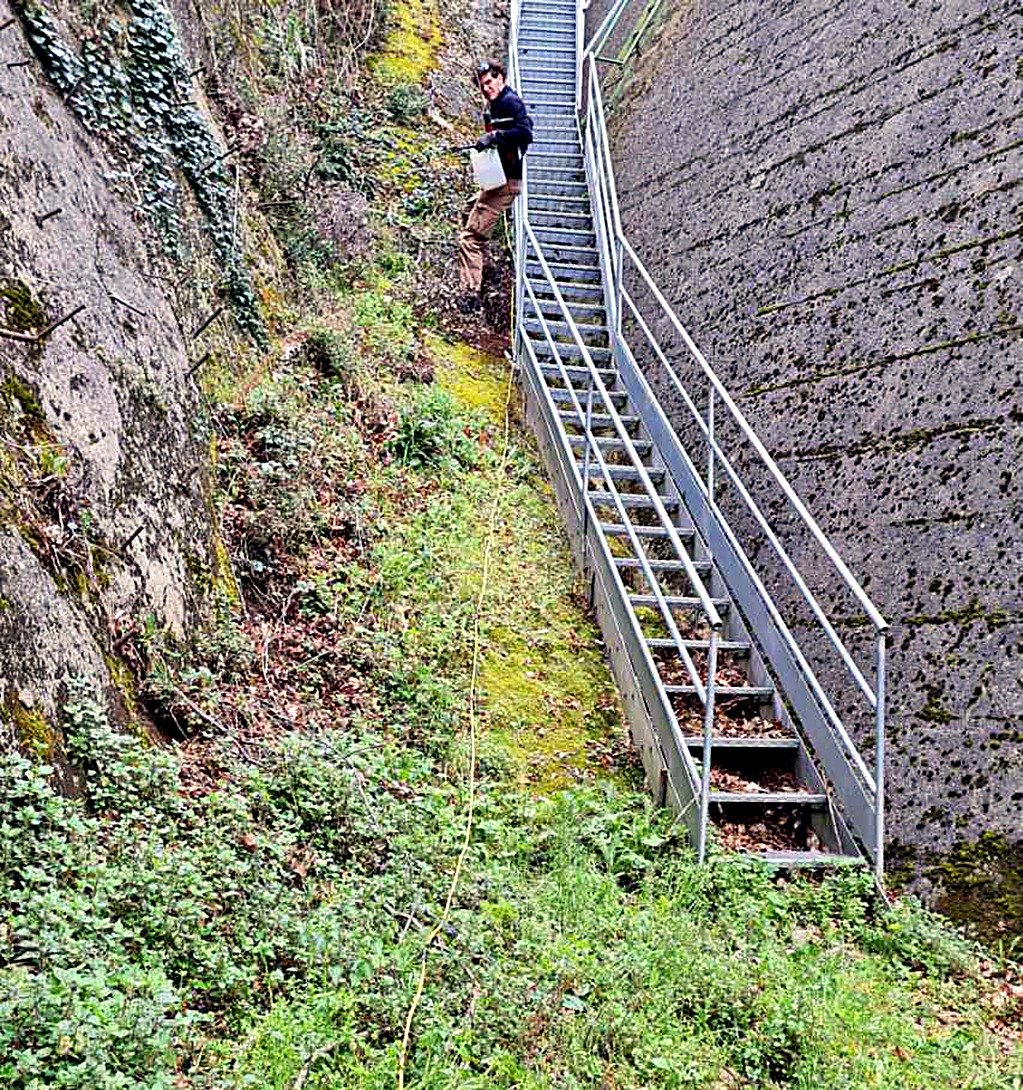
Short answer. It sends current into the ground through two electrodes and measures the voltage across two others. Dry, compact rock resists the current. Clay and water let it through. The difference becomes a picture.
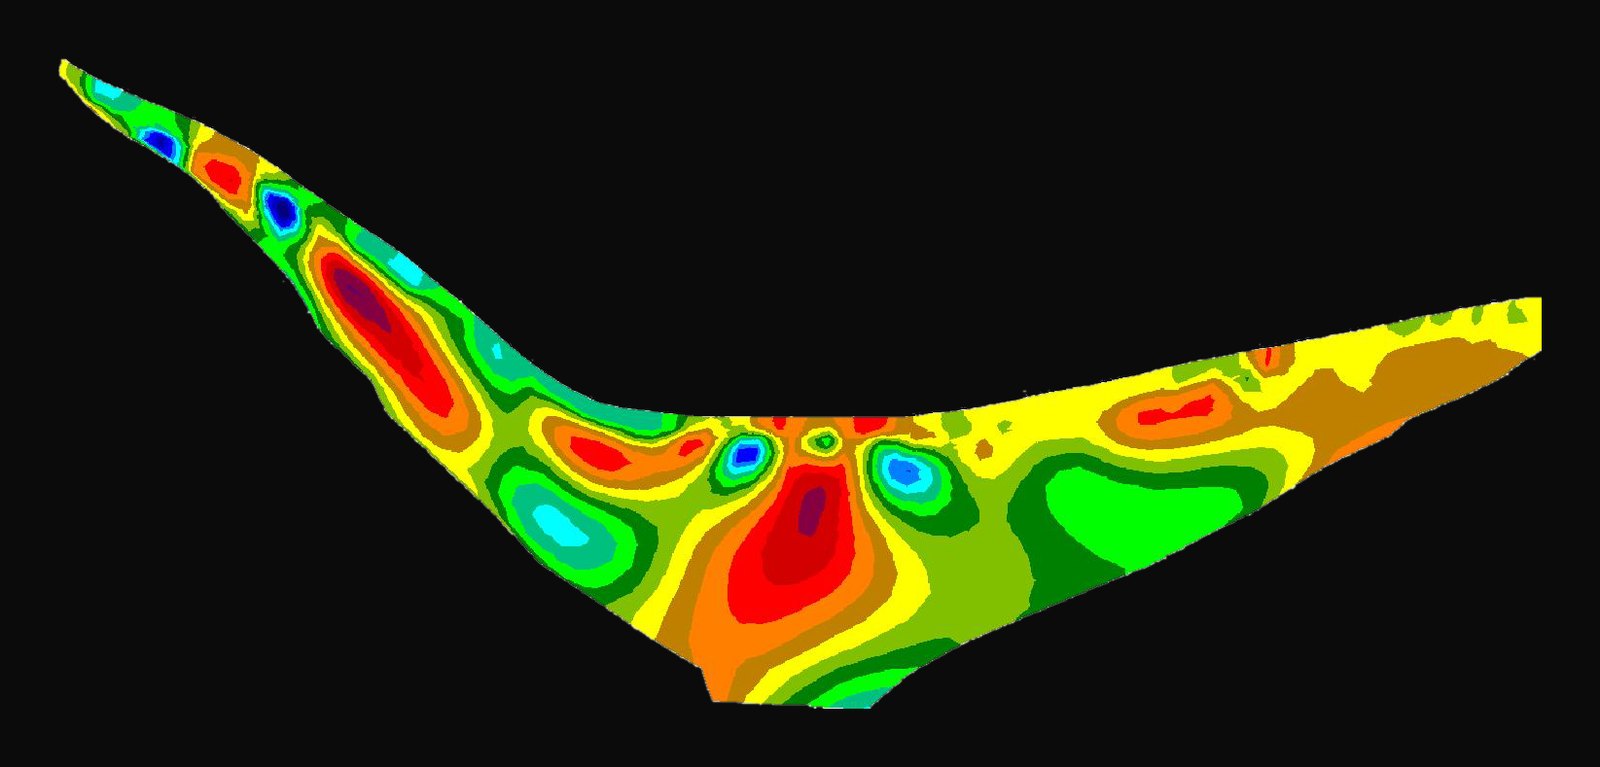
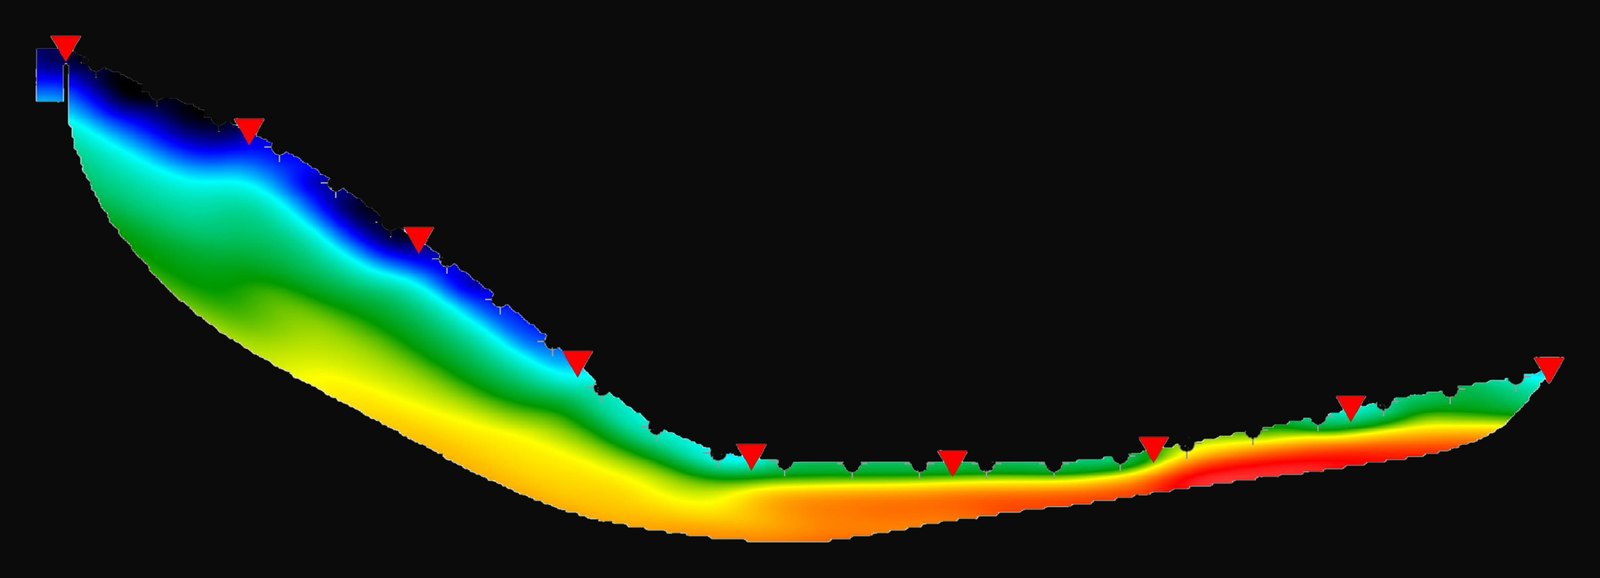
Resistivity depends on how saturated the pores are, on porosity, on the salinity of the water, and on the amount of clay. That is why a resistivity section is read as a map of ground conditions rather than a list of rock types. The computer inverts thousands of measurements into a model of the true resistivity at depth, shown on a colour scale from blue, low, to red, high.
On the three lines at Casoli, resistivity ranged from 2 to 1,000 ohm-metres. Values above 200–300 ohm-metres sit in the first 5 to 10 metres and point to made ground or a weathered cover. Below, values under 200 ohm-metres belong to the local substrate: alternating clayey–marly and calcareous–marly layers.
How does seismic refraction see the ground?
Short answer. It times a wave. A hammer blow sends a seismic wave into the ground, and the geophones record when it first arrives. Waves travel faster through stiff rock than through loose soil, so arrival times become a velocity map.
The first arrivals were picked on every shot record and inverted with a wave-path tomography to build a model of P-wave velocity along each line. On the surface lines, velocities ranged from 800 to 4,900 metres per second. Under 1,300 metres per second, in the first 5 to 10 metres, the ground is made ground or weathered cover. Above 1,300, it is the same marly and calcareous substrate that the resistivity lines showed.
Why two methods?
Short answer. Because each method has blind spots, and a model should hold only where independent measurements agree. Here they agree on the same boundary, 5 to 10 metres below the surface.
Resistivity follows water, clay and fracturing. Seismic velocity follows stiffness, which is what a seismic assessment needs. They are also fooled in different ways. A heavily fractured rock and a saturated detrital deposit, for example, can show the same P-wave velocity, between 1,400 and 1,700 metres per second. Resistivity responds to other properties of the ground, so it gives a second, independent reading, and each method checks the other. This is the idea behind our Multilevel Survey System: independent methods that validate one another.
What did the lines on the crest show?
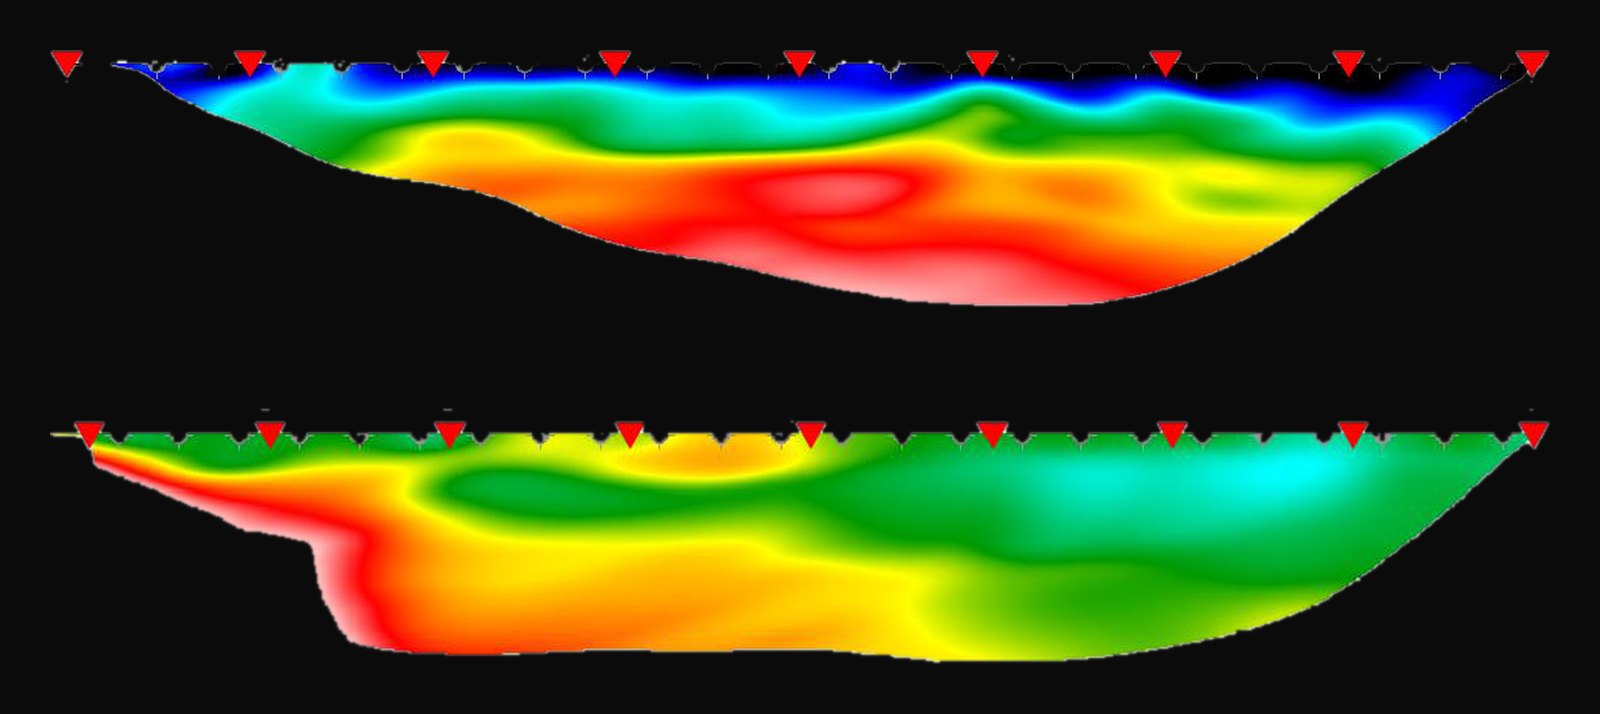
Short answer. A stiff body below a thin skin. Along the crest of the dam, P-wave velocities were generally above 2,000 metres per second, and S-wave velocities ran from 400 to 3,000 metres per second.
The crest line was recorded in both wave types, which adds information: P-waves travel through water and rock alike, while S-waves are carried only by the solid skeleton of the ground. Reading the two together tells a more careful story than either alone.
What happened inside the tunnel?
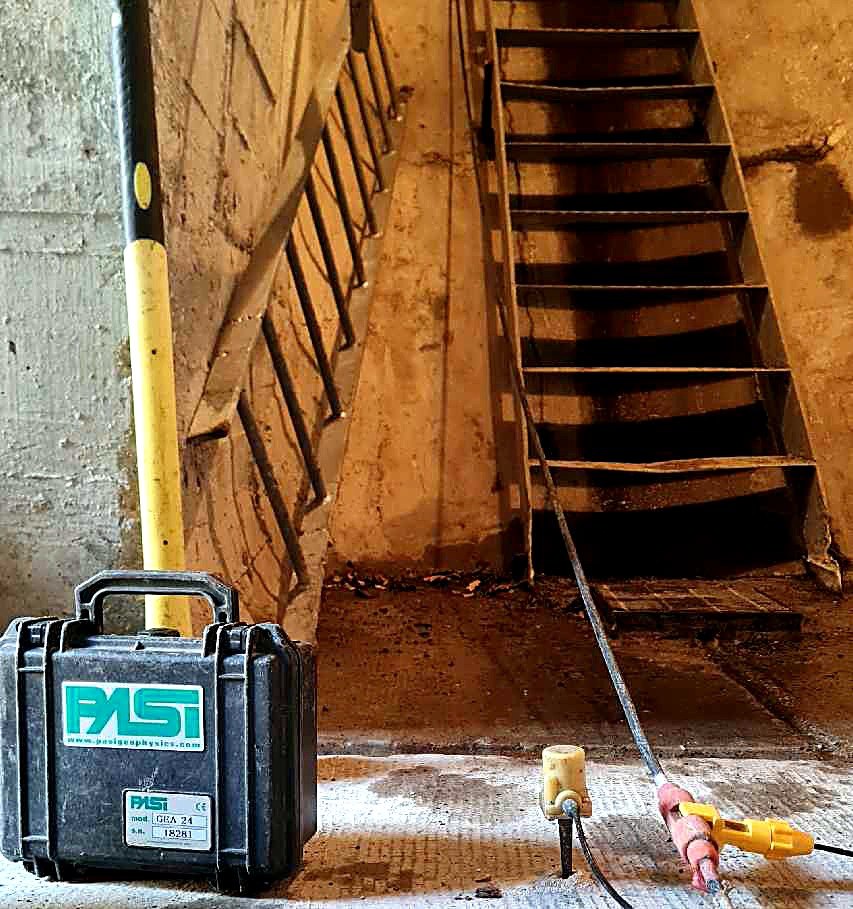
Short answer. The signal was disturbed, and we say so. Inside the tunnel, the geometry of the acquisition is complex and the walls return echoes, multiple reflections and direct waves. The P and S velocities from that line are therefore underestimated.
This is part of a good survey, not a footnote to it. A velocity that reads low because of echoes is not a weak ground, and a report that does not say so invites the wrong conclusion. The tunnel line is a record of what could be measured there, with its limit written next to it.
Frequently asked questions
Does geophysics replace drilling? No. Geophysics tells you where to look and how the ground changes between points. Drilling, where it is needed, confirms what the geophysics flagged. The two work in that order.
How deep did the survey reach? The electrical lines investigated 45 to 50 metres. The seismic lines reached 20 to 50 metres, depending on the line.
How precise is the positioning? Every electrode, geophone and shot point was surveyed with GNSS RTK, in the UTM WGS84 33N coordinate system, so every section can be placed on the map and compared line against line.
Can you survey inside a structure? Yes, with a limit that has to be declared. The tunnel line was recorded, and its velocities are reported as underestimated because of echoes and the complex geometry.
What do you deliver? A technical report with the acquisition, the processing and the final sections on plates, with every element georeferenced.
Looking at a dam, a bridge or a foundation that has to be re-checked for seismic loads? Send us the site before the first verification: we tell you what is underneath.